
Largest Oil & Gas Companies in the World (2026 Ranking)

The largest oil companies play a central role in the global energy system, shaping oil supply, investment flows, and energy markets worldwide. In 2026, the world’s leading oil and gas majors are evaluated not only by their scale but also by financial strength and production capacity. Analysts typically compare the largest oil companies by market cap, revenue, and daily production to understand their true industry influence. This ranking highlights the top oil producers and integrated energy giants that dominate global petroleum markets, from national champions to international supermajors, offering a clear overview of the companies that currently lead the global oil and gas industry.
Rather than a generic “top 10” list, this version is designed to match high-intent search queries such as:
- largest oil and gas companies by market cap 2026
- top oil companies by revenue 2026
- largest oil companies in the world 2026
- top 10 oil and gas companies by market capitalization 2026
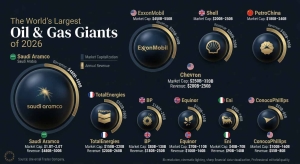
Note: Rankings can shift based on share price movements, FX rates, and updated financial results. This article is intended as an analytical overview, not a real-time stock quote feed.
Table of the largest oil and gas companies in the world
| RANK | COMPANY | COUNTRY | MARKET CAP (2025-26 APPROX.) | ANNUAL REVENUE (FY2025-26 APPROX.) | PRODUCTION (boe/d) |
|---|---|---|---|---|---|
| 1 | Saudi Aramco | Saudi Arabia | Approx. 1.8T–2.0T | Approx. 480B–500B | Approx. 12.9 million |
| 2 | ExxonMobil | United States | Approx. 450B–550B | Approx. 330B–360B | Approx. 4.7 million |
| 3 | Shell | United Kingdom | Approx. 200B–250B | Approx. 280B–330B | Approx. 2.801 million |
| 4 | PetroChina | China | Approx. 180B–240B | Approx. 400B–500B | Approx. 5.05 million |
| 5 | Chevron | United States | Approx. 250B–320B | Approx. 200B–250B | Approx. 3.7 million |
| 6 | TotalEnergies | France | Approx. 150B–220B | Approx. 200B–260B | – |
| 7 | BP | United Kingdom | Approx. 80B–130B | Approx. 180B–250B | – |
| 8 | Equinor | Norway | Approx. 70B–110B | Approx. 100B–160B | – |
| 9 | Eni | Italy | Approx. 40B–70B | Approx. 90B–140B | – |
| 10 | ConocoPhillips | United States | Approx. 100B–160B | Approx. 55B–80B | Approx. 2.375 million |
1. Saudi Aramco (Saudi Arabia)
Saudi Aramco remains the world’s largest and most influential oil company in 2026. Its dominance comes from massive reserves, ultra‑low lifting costs, and unmatched upstream capacity.
Key Metrics
Aramco’s market cap is around 1.8–2.0trillion,withannualrevenuenear1.8–2.0 trillion, with annual revenue near 480–500 billion. The company produces roughly 12.0–12.9 million boe/d and employs over 70,000 people.
Global Operations
Although Saudi‑based, Aramco operates global refining, petrochemical, and joint‑venture assets across Asia, Europe, and the U.S., along with major investments in hydrogen, ammonia, and CCUS technologies.
Why It’s Ranked
Lowest-cost producer, enormous reserves, strong dividends, and unmatched strategic importance in global oil markets.
2. ExxonMobil (United States)
ExxonMobil is one of the strongest Western supermajors, known for its large upstream portfolio and significant expansion in Guyana and the Permian Basin.
Key Metrics
The company’s market cap ranges from 450–550billion,withrevenueof450–550 billion, with revenue of 330–360 billion and production near 4.7 million boe/d. ExxonMobil employs over 60,000 people globally.
Global Operations
Its operations span major basins in the U.S., offshore Guyana, Canada, and large downstream and chemical facilities worldwide.
Why It’s Ranked
High‑quality assets, strong cash flow, aggressive shareholder returns, and excellent operational execution.
3. Shell plc (United Kingdom)
Shell is a global leader in LNG and integrated gas, benefiting from strategic demand for secure natural gas supply worldwide.
Key Metrics
Shell’s market cap sits around 200–250billion,withannualrevenueof200–250 billion, with annual revenue of 280–330 billion. Production averages about 2.8 million boe/d.
Global Operations
Shell operates in 70+ countries with one of the world’s largest LNG portfolios, extensive refining assets, and a major global trading network.
Why It’s Ranked
Top-tier LNG position, large international footprint, strong trading capabilities, and diversified energy exposure.
4. China National Petroleum Corporation – PetroChina (China)
PetroChina is Asia’s largest oil and gas producer and plays a central role in China’s domestic energy security and supply stability.
Key Metrics
It has a market cap of 180–240billion,revenueof180–240 billion, revenue of 400–500 billion, and production around 5.0 million boe/d. PetroChina employs hundreds of thousands worldwide.
Global Operations
While China‑focused, it maintains international upstream projects across Asia, Central Asia, and the Middle East.
Why It’s Ranked
Massive domestic market, strong integration, strategic state-backed position, and balanced oil and gas exposure.
5. Chevron Corporation (United States)
Chevron is known for disciplined capital management, a strong balance sheet, and a high‑quality upstream portfolio.
Key Metrics
Market cap ranges from 250–320billion,withrevenueat250–320 billion, with revenue at 200–250 billion. The company produces roughly 3.7 million boe/d and has ~40,000 employees.
Global Operations
Chevron’s main operations include U.S. shale (Permian), major projects in Kazakhstan, and LNG assets in Australia.
Why It’s Ranked
Financial discipline, strong dividends, reliable upstream production, and robust long-term projects.
6. Total Energies (France)
TotalEnergies has built one of the most balanced portfolios among global energy majors, combining hydrocarbons with large LNG and renewable energy investments.
Key Metrics
The company holds a market cap of 150–220billionandrevenueof150–220 billion and revenue of 200–260 billion. Production spans millions of boe/d across diverse regions.
Global Operations
Operating in 100+ countries, the company maintains strong LNG positions, major upstream assets, and expanding renewable capacity.
Why It’s Ranked
Wide energy diversification, strong LNG exposure, active renewable expansion, and resilient global portfolio.
7. BP plc (United Kingdom)
BP remains a global integrated major undergoing a strategic restructuring aimed at improving profitability while maintaining energy-transition exposure.
Key Metrics
BP’s market cap is around 80–130billion,withrevenueof80–130 billion, with revenue of 180–250 billion. The firm produces millions of boe/d and runs extensive downstream operations.
Global Operations
BP maintains upstream, refining, trading, and retail networks across Europe, North America, and Asia.
Why It’s Ranked
Portfolio reset potential, global infrastructure, strong downstream assets, and broad market presence.
8. Equinor (Norway)
Equinor is a leading offshore producer with strong expertise in subsea engineering and a major supplier of natural gas to Europe.
Key Metrics
The company has a market cap of 70–110billionandrevenueof70–110 billion and revenue of 100–160 billion. Its production largely comes from the Norwegian continental shelf.
Global Operations
Equinor operates offshore projects in the North Sea, Brazil, and the U.S. while investing heavily in offshore wind and CCS.
Why It’s Ranked
Offshore excellence, stable gas supply to Europe, strong low‑carbon capabilities, and reliable operations.
9. Eni S.p.A. (Italy)
Eni is known for its fast-moving exploration strategy and strong upstream presence in Africa and the Mediterranean region.
Key Metrics
Eni’s market cap is 40–70billion,with40–70 billion, with 90–140 billion in annual revenue and significant upstream output.
Global Operations
The company operates major gas fields in Africa, alongside refining and fuel networks across Europe.
Why It’s Ranked
Strong exploration success, upstream growth potential, and strategic positioning in emerging gas hubs.
10. ConocoPhillips (United States)
ConocoPhillips is the world’s largest independent E&P operator, offering direct exposure to oil price cycles without downstream complexity.
Key Metrics
Its market cap stands at 100–160billion,revenueat100–160 billion, revenue at 55–80 billion, and production around 2.3–2.4 million boe/d.
Global Operations
ConocoPhillips operates shale and conventional assets in the U.S., Canada, Alaska, and select global basins.
Why It’s Ranked
Pure E&P focus, strong leverage to oil prices, efficient operations, and attractive growth for cyclical investors.
Market Outlook: Will Crude Oil Prices Increase?
The outlook for crude oil in 2026 remains mixed.
Global supply growth continues to be supported by the United States, Saudi Arabia, and other major producers, while demand growth is more moderate. As a result, the market may remain under pressure unless stronger demand or a geopolitical shock tightens supply.
Base-case view
Brent crude is likely to trade in a broad range rather than trend sharply higher.
What could drive prices up
- Disruptions in the Middle East
- Faster-than-expected demand recovery in China
- Production cuts from major exporters
What could keep prices capped
- Strong U.S. output
- Slower global growth
- Weak industrial demand in key markets
Key Industry Resources
To better understand the logistical and chemical side of the industry, it is essential to monitor the production and trade of secondary petroleum products. The demand for industrial materials like bitumen for infrastructure and sulfur (a byproduct of desulfurization) remains a key indicator of global economic health.
If you are looking for geographical data, see our lists of:
Countries with the largest oil reserves
Largest oil producing countries
Largest oil consuming countries
Largest oil exporting countries
top gasoline producing countries
top diesel producing countries
Frequently Asked Questions (FAQ)
What is the largest oil company in 2026?
Saudi Aramco remains the largest oil company in 2026 based on production capacity, proven reserves, and global market influence.
Which oil company has the highest market cap?
Saudi Aramco holds the highest market capitalization globally, typically followed by ExxonMobil and Chevron. Market cap may fluctuate with share prices.
Who produces the most oil per day?
Saudi Aramco leads global production with more than 12 million barrels of oil equivalent per day (boe/d). PetroChina and ExxonMobil are also among the top producers.
Which national oil companies are the biggest?
The largest National Oil Companies (NOCs) include Saudi Aramco (Saudi Arabia), CNPC/PetroChina (China), ADNOC (UAE), and QatarEnergy (Qatar).
What oil companies dominate LNG?
Shell is widely considered the global LNG leader, followed by TotalEnergies and QatarEnergy due to their large liquefaction and trading portfolios.
Which oil companies are best for long-term investors?
Companies such as Saudi Aramco, ExxonMobil, Chevron, Shell, and TotalEnergies are often viewed as strong long-term investments due to stable cash flows, dividends, and diversified portfolios. Investment suitability depends on individual risk tolerance.
What factors determine company ranking?
Rankings are based on key financial and operational metrics including:
- Market Capitalization
- Annual Revenue
- Daily Production (boe/d)
- Proven Reserves
- Global Operational Footprint
Are national oil companies larger than private companies?
In most cases, yes. National Oil Companies control the majority of global oil and gas reserves and often produce higher volumes than International Oil Companies.
Which companies grow fastest in 2026?
Companies with major assets in Guyana (ExxonMobil), the Permian Basin (Chevron, ConocoPhillips), and global LNG expansion (Shell, TotalEnergies) are among the fastest-growing players in 2026.






Leave a Reply
Want to join the discussion?Feel free to contribute!